August 2018
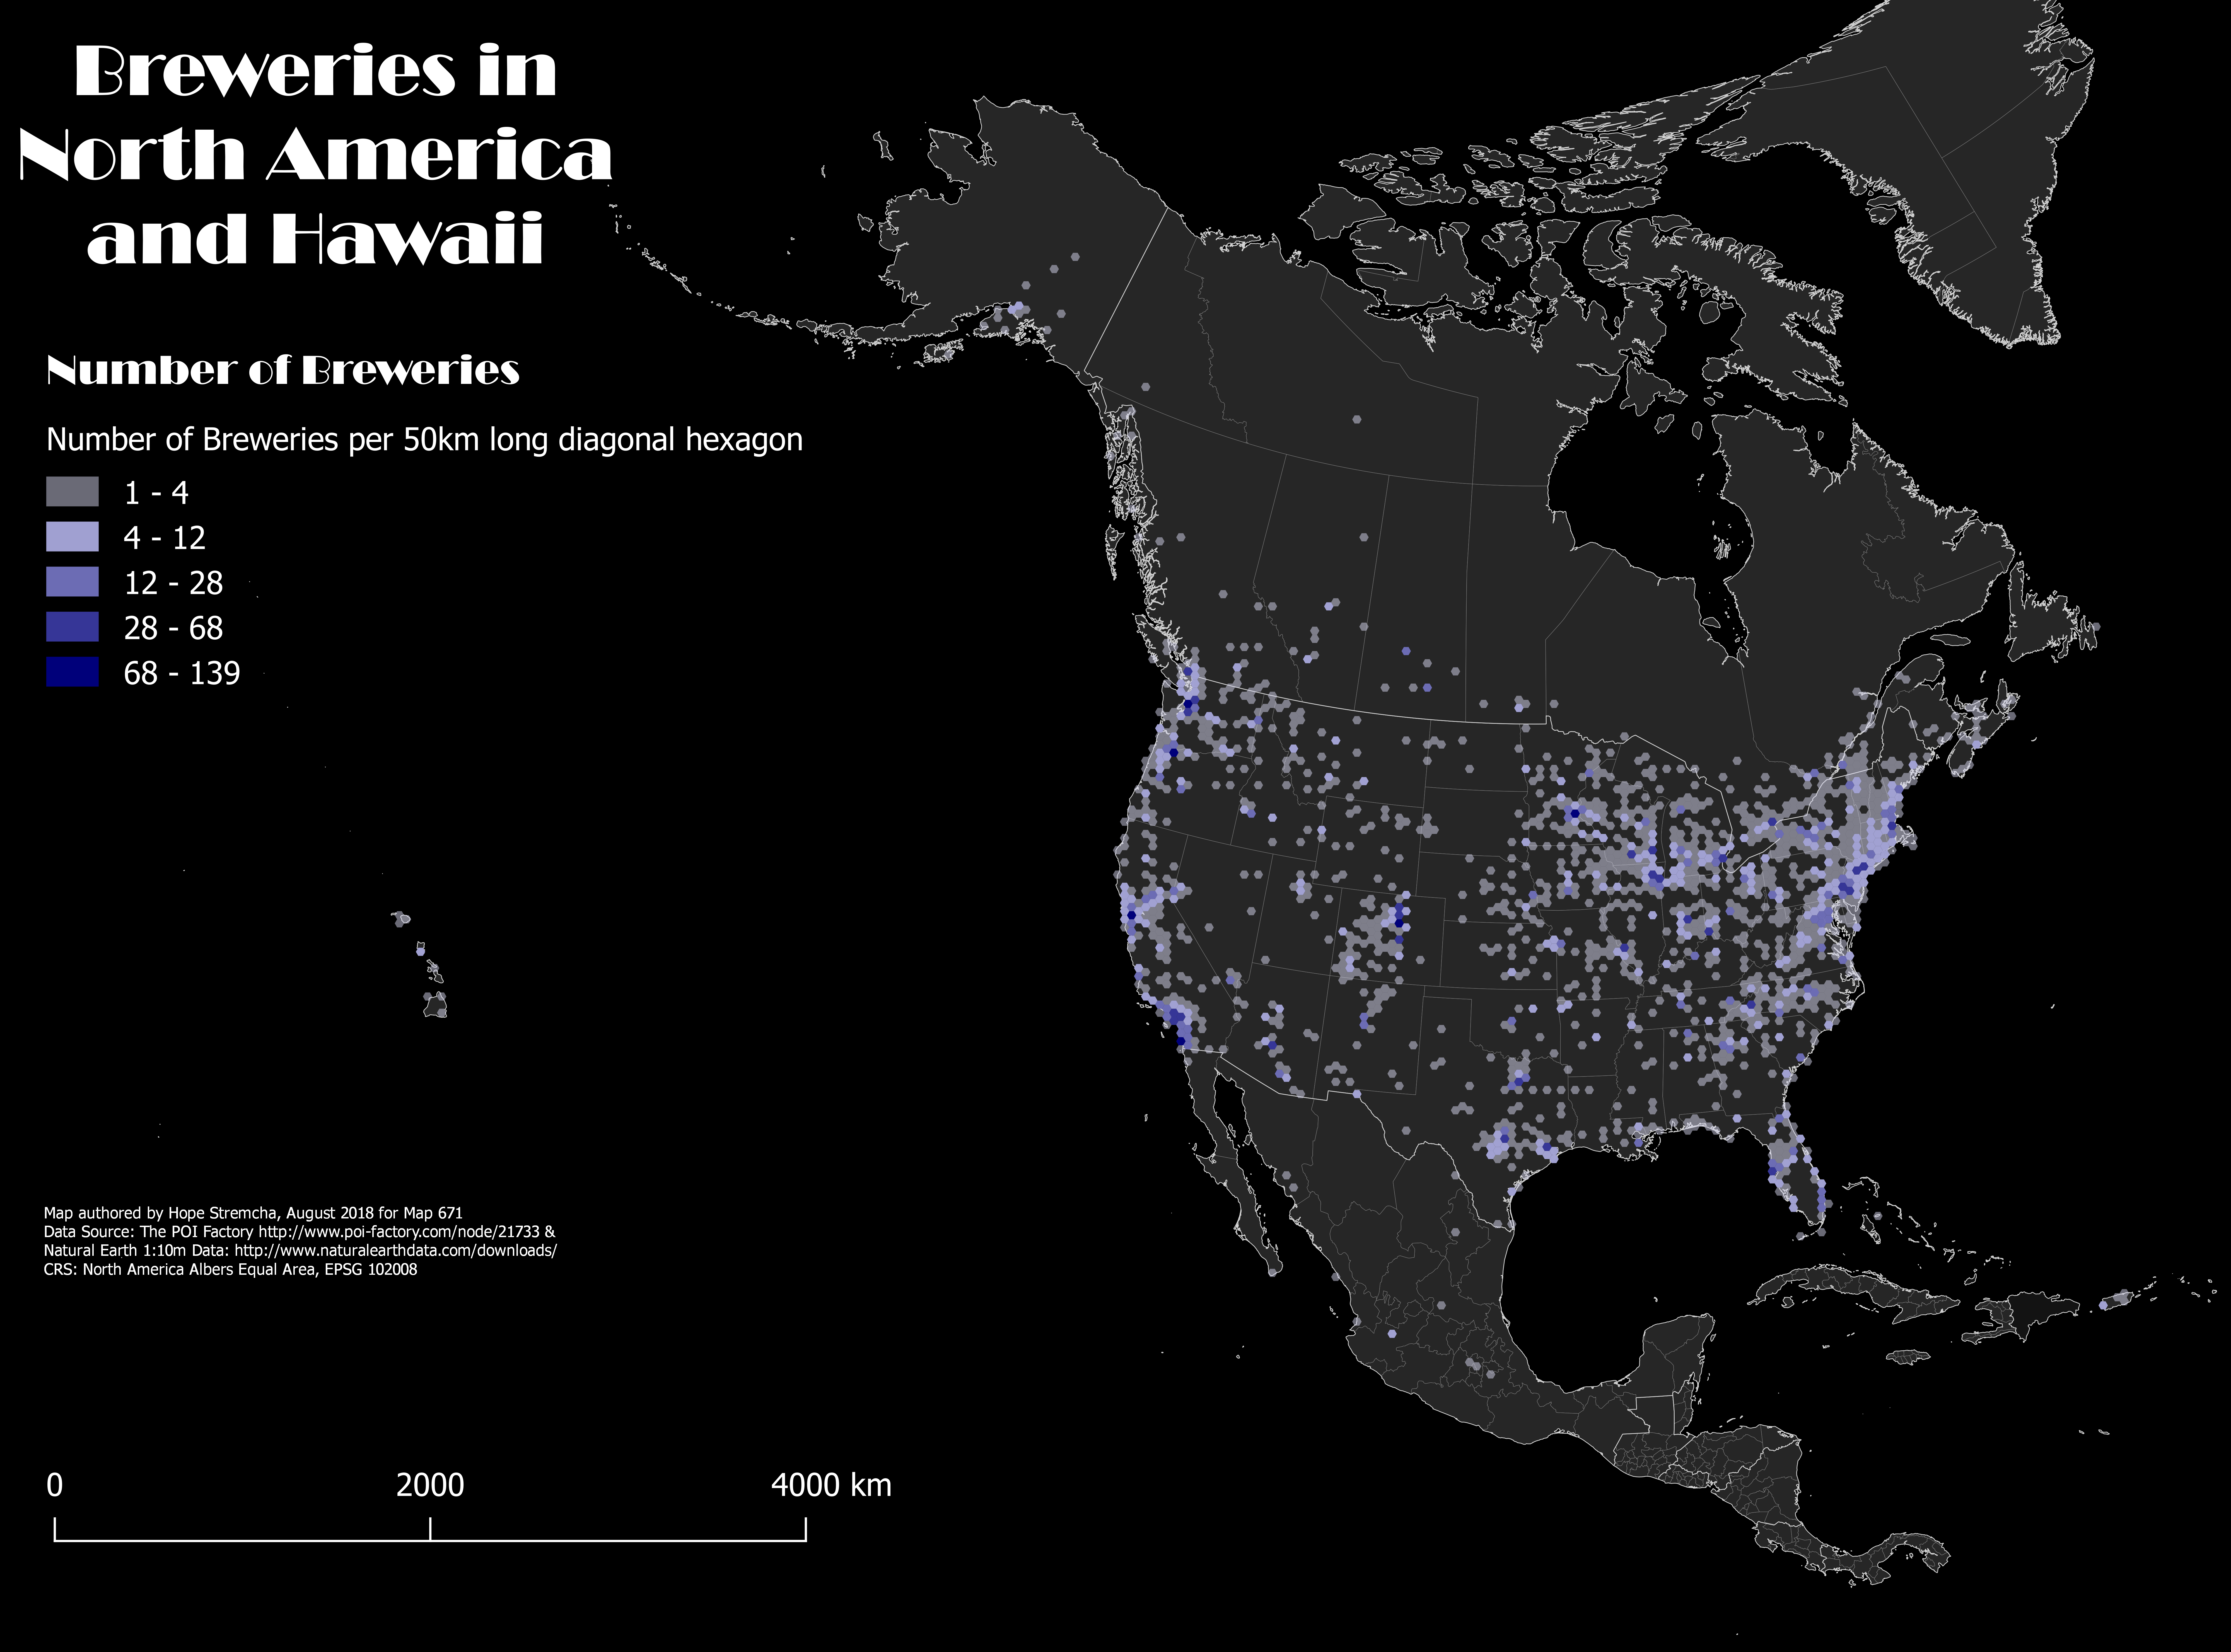
A map showing the number of breweries per 50 km long diagonal hexagon in North America and Hawaii. Data from The POI Factory and Natural Earth
August 2018
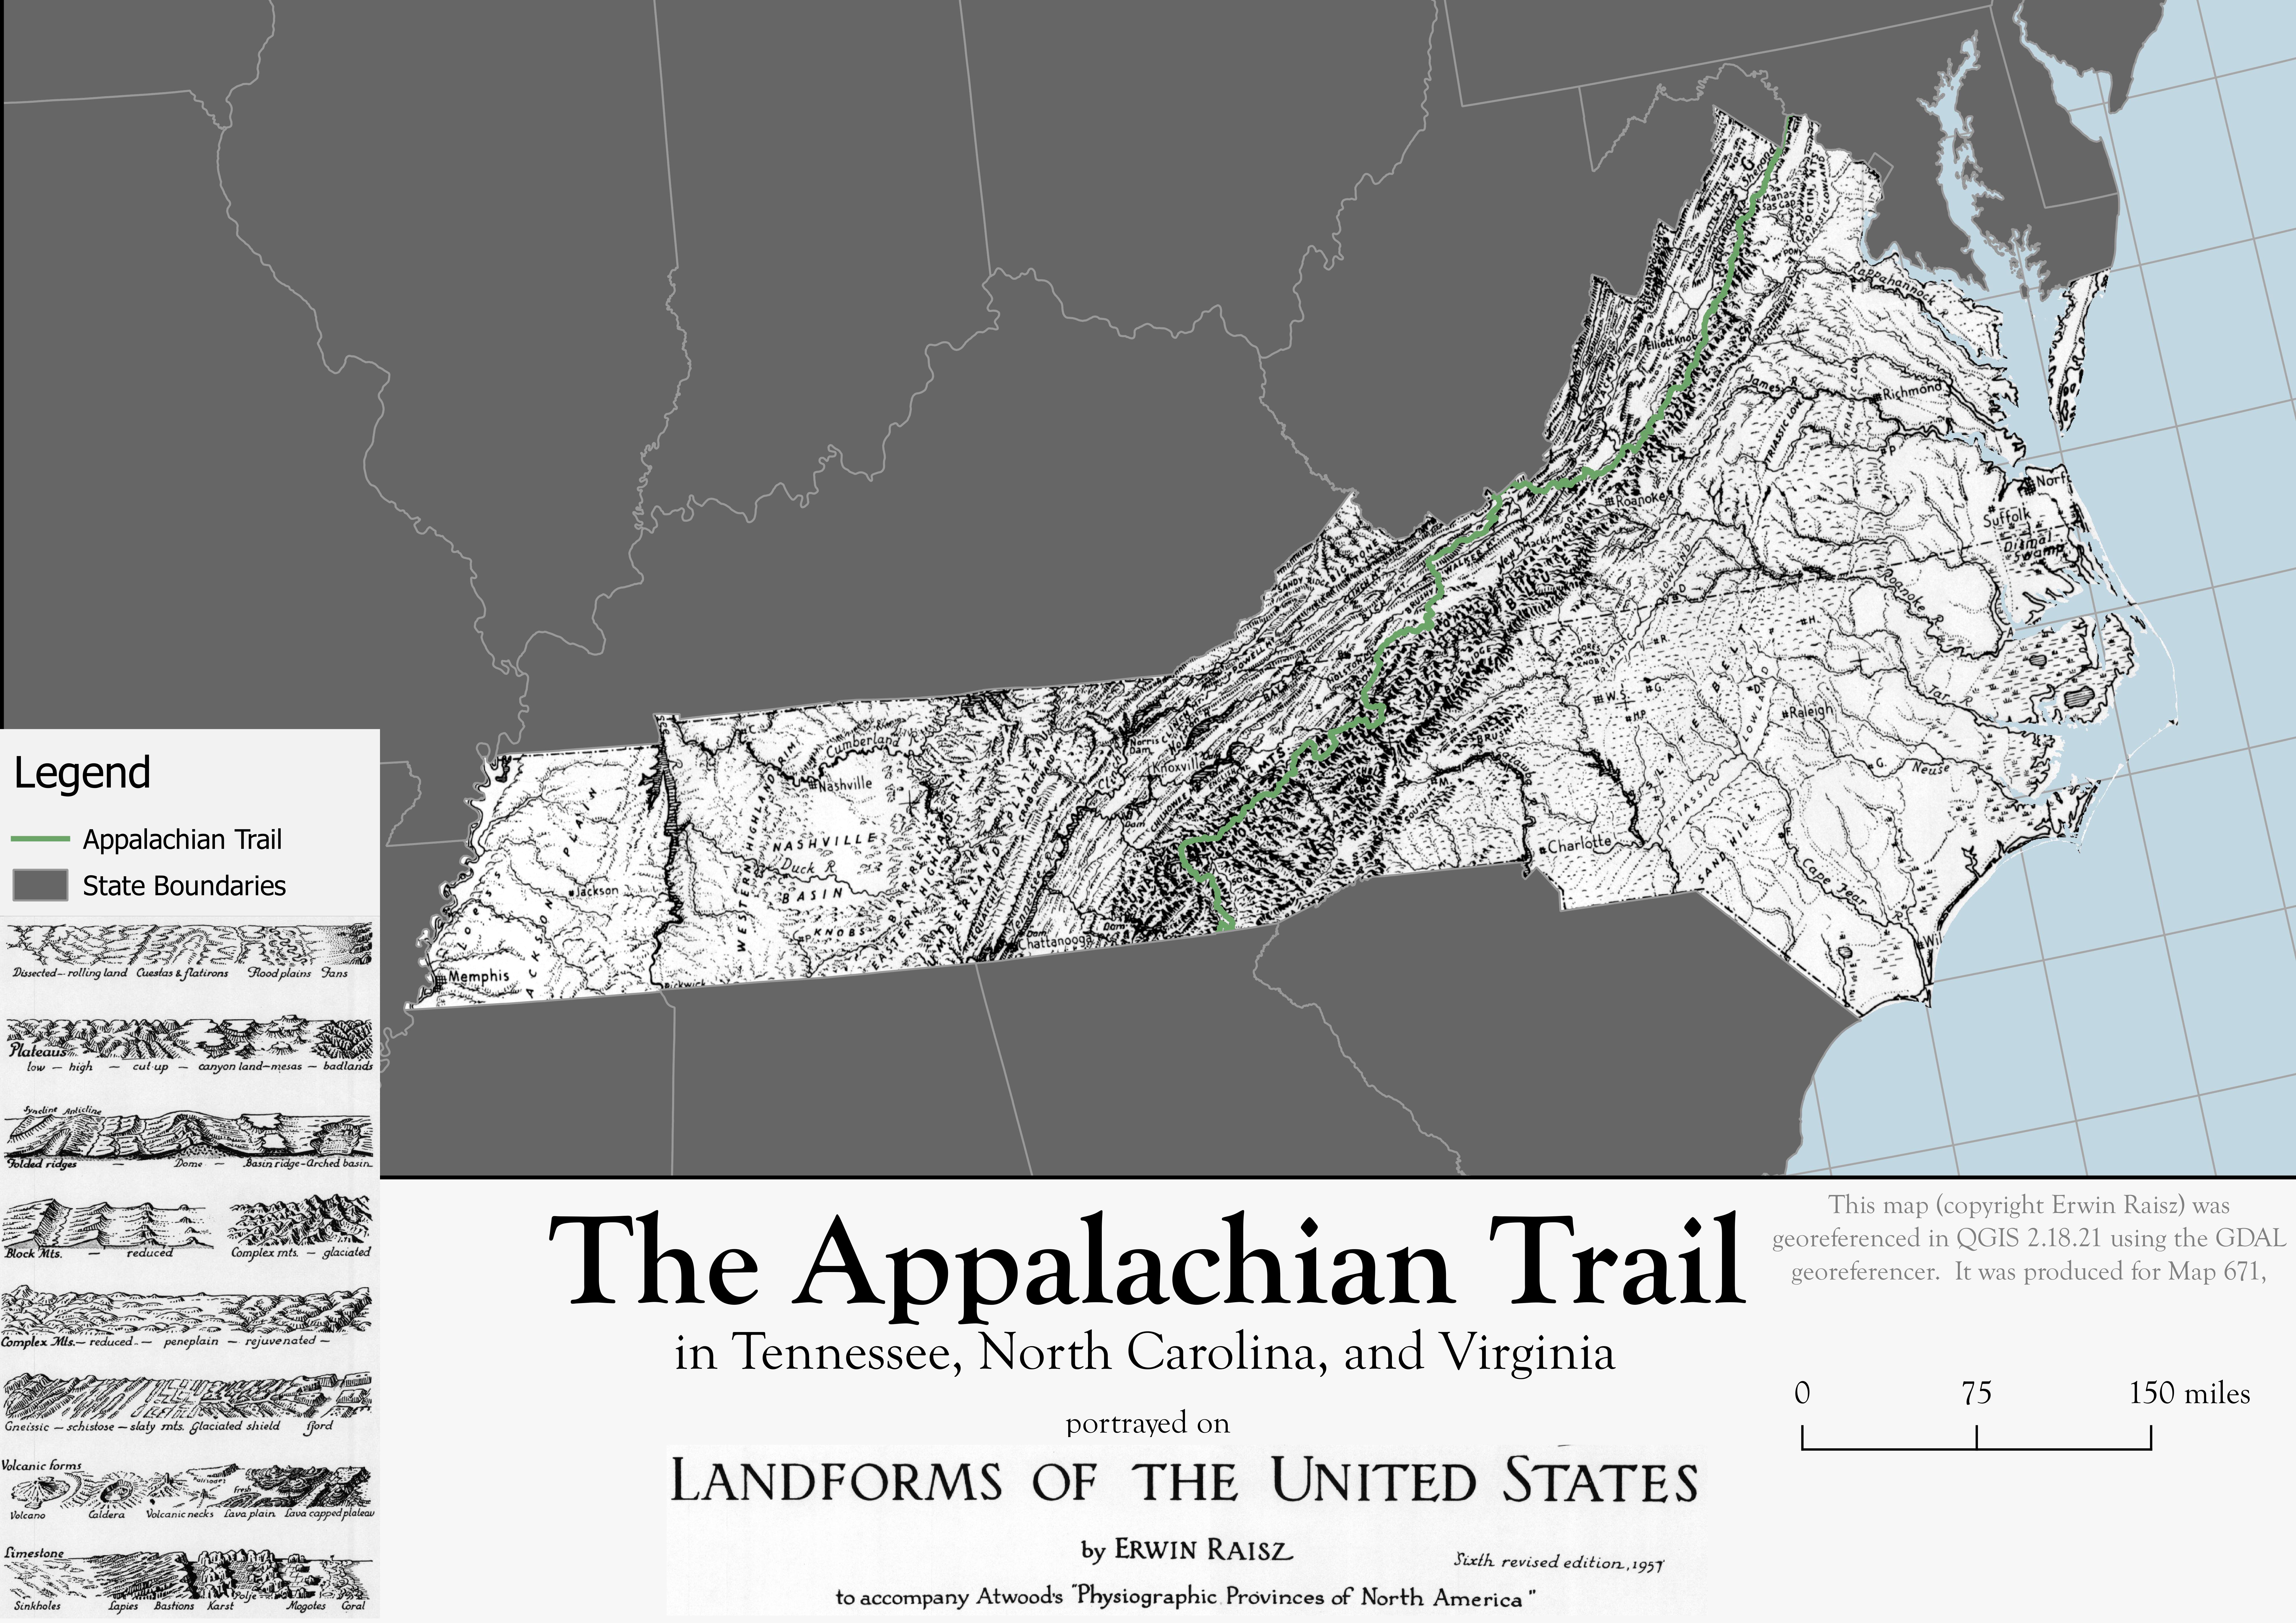
A map showing The Appalachian Trail in TN, NC, and VA portrayed on Erwin Raisz's "Landforms of the United States," georeferenced using the GDAL georeferencer.
August 2018
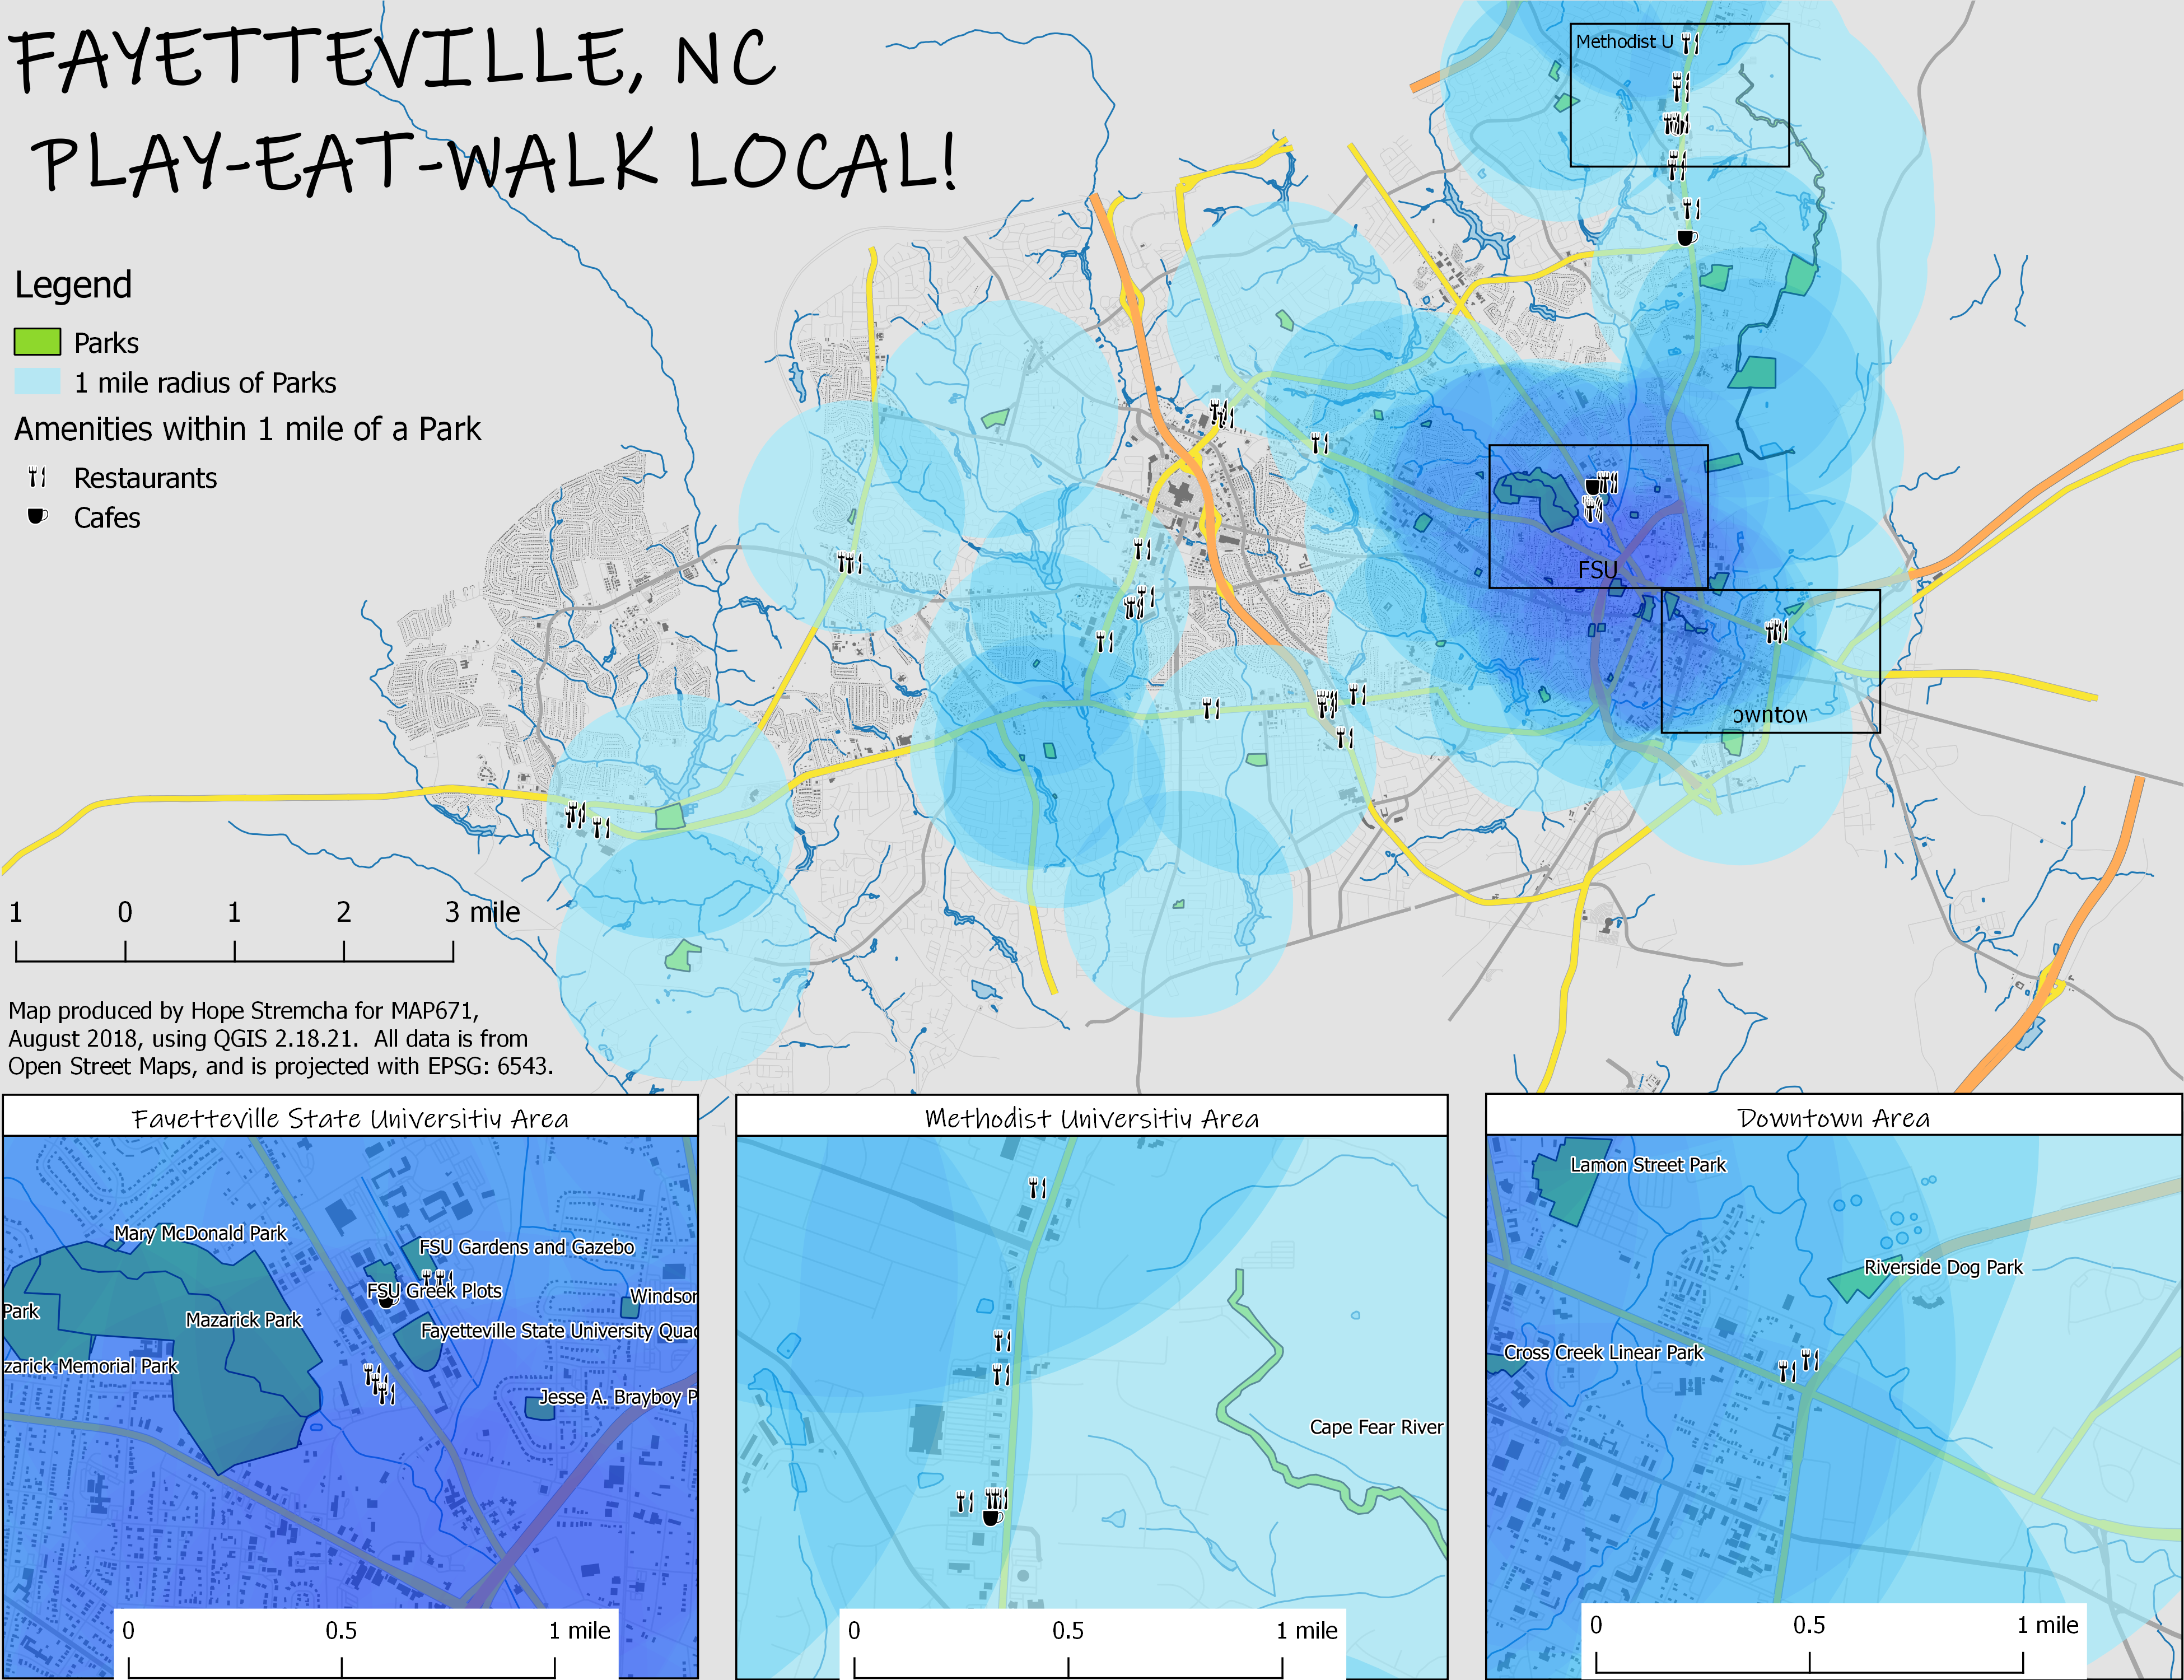
A Heat Map showing all restaurants and cafes within 1 mile of parks in Fayetteville, NC. All amenity data is from OpenStreetMap
September 2018
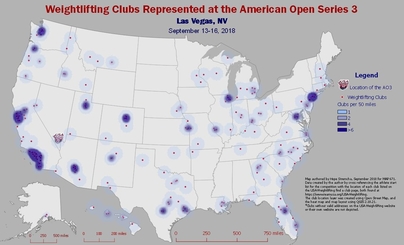
A map web page showing the density of weightlifting clubs represented at the American Open Series 3, 2018. All data from USA Weightlifting
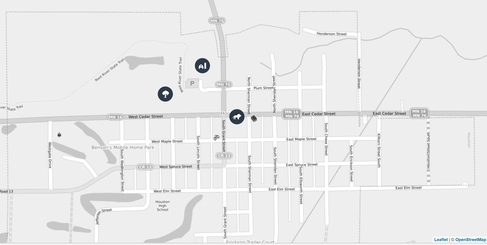
November 2018
A map of my hometown showing key landmarks and the route to my first job, created with Leaflet.
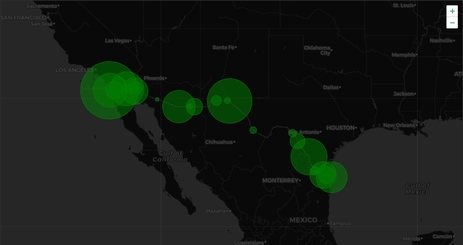
December 2018
An interactive map webpage showing the number of US Southern Border entries at Ports of Entry in September 2018. Border Crossing data accessed from the University of Arizona , created by the from the The US Bureau of Transportation Statistics, and updated with September 2018 statistics by the map author.
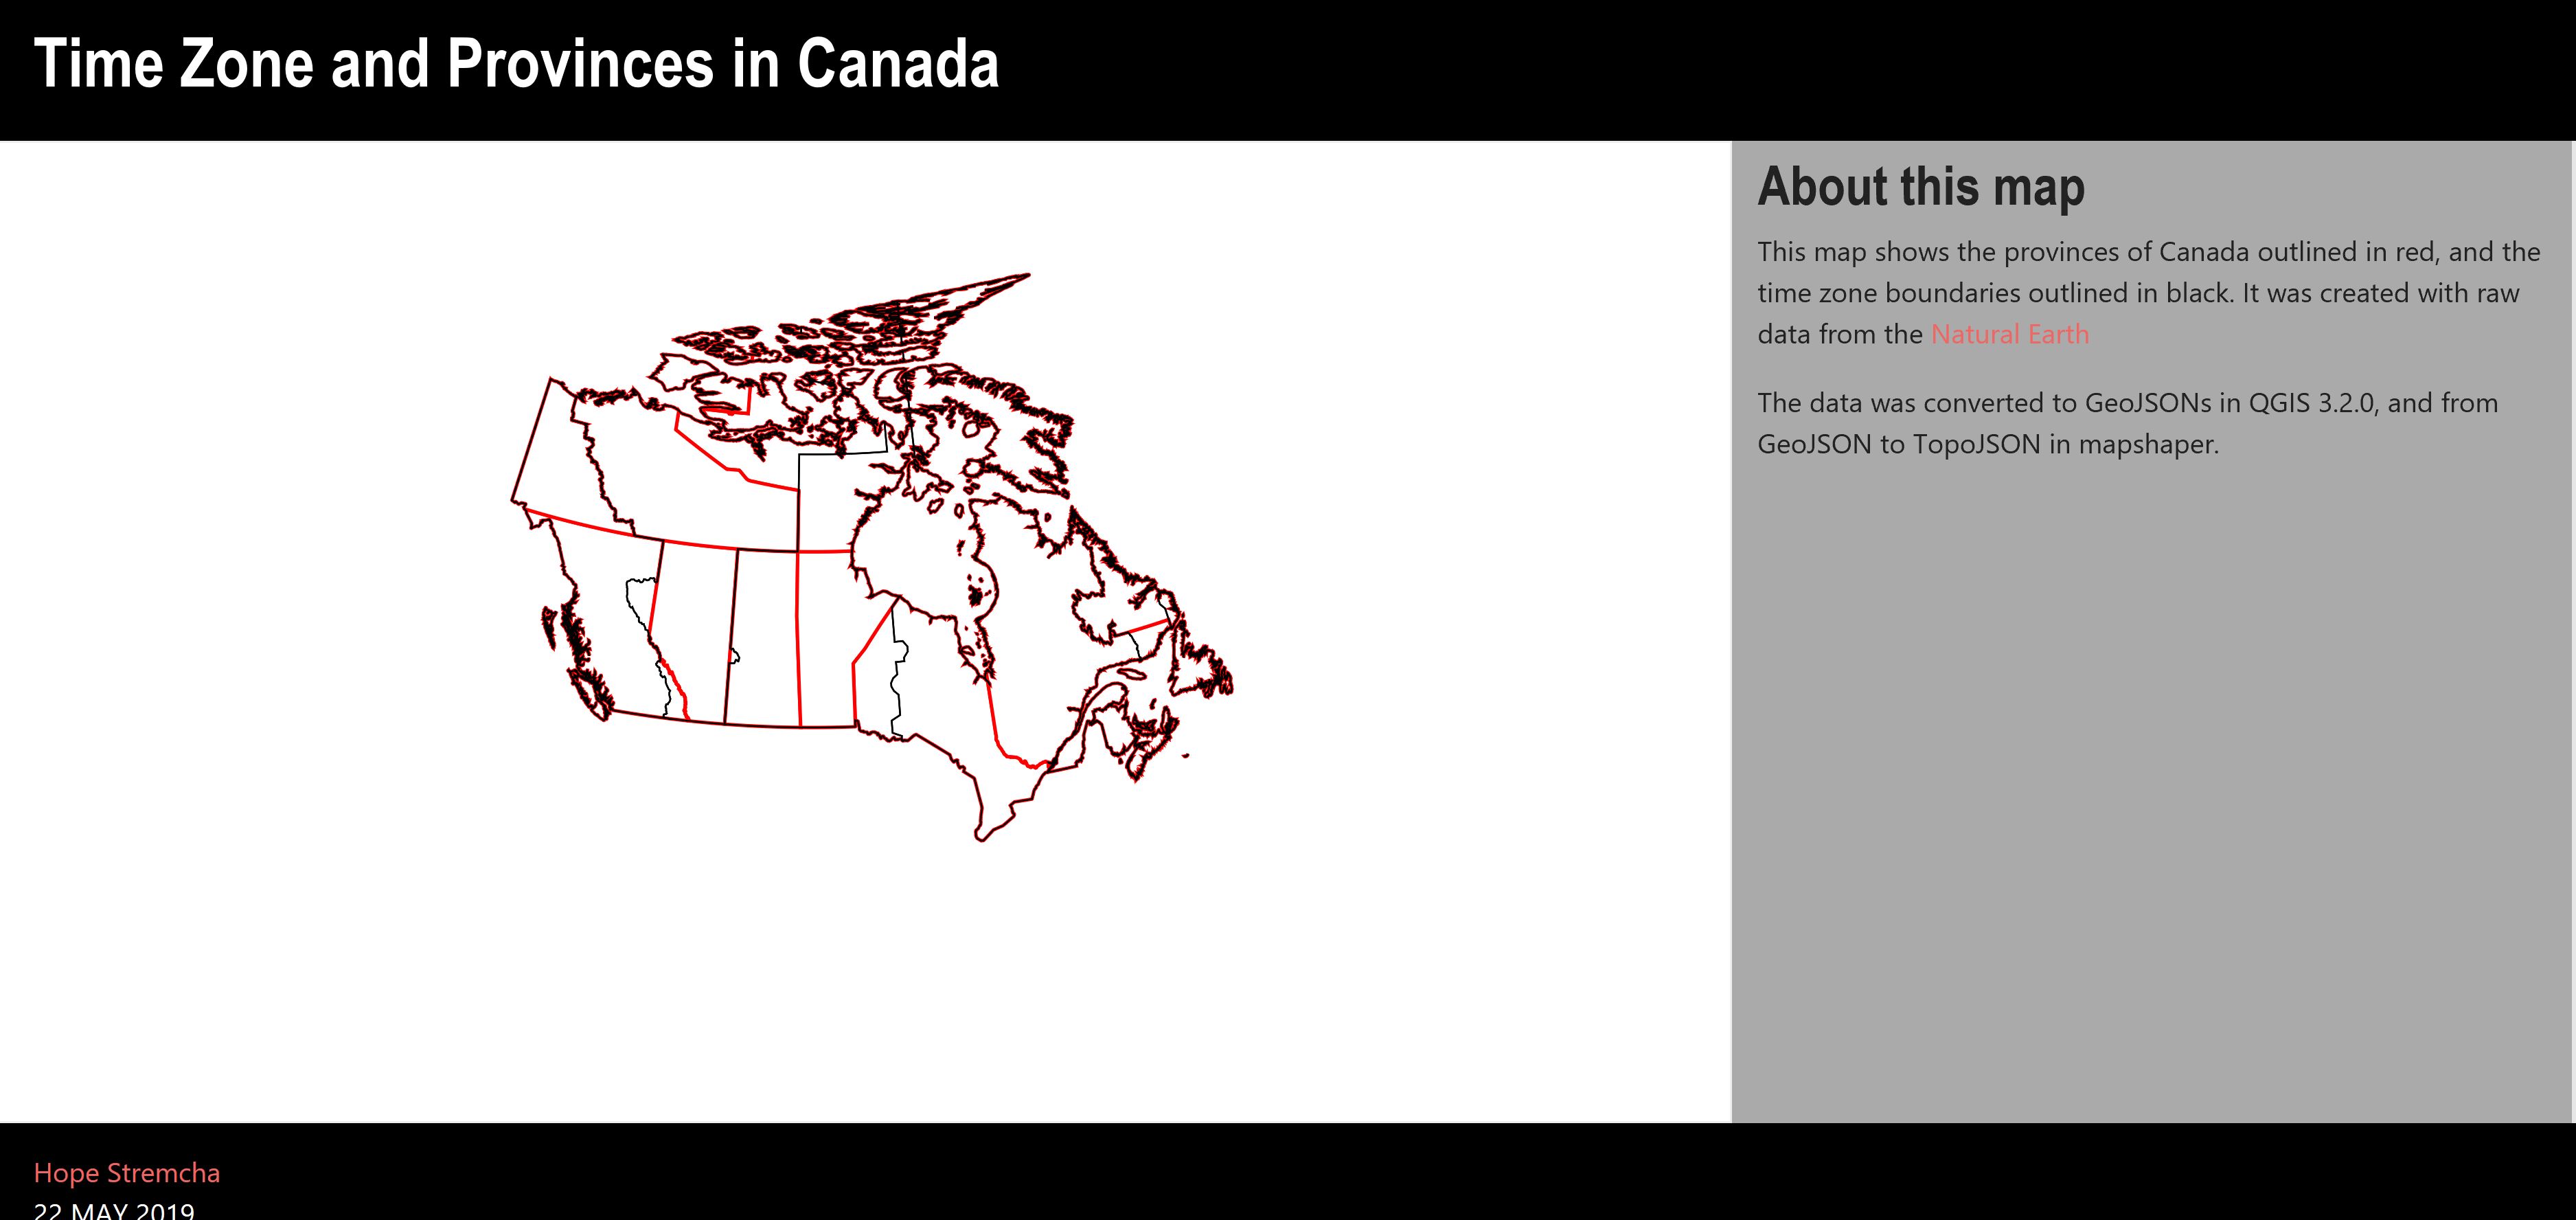
May 2019
An interactive map webpage showing the number of provinces of Canada with the Time Zone boundaries in Canada. It was created with raw data from the Natural Earth. The data was converted to GeoJSONs in QGIS 3.2.0, and from GeoJSON to TopoJSON in mapshaper.
June 2019
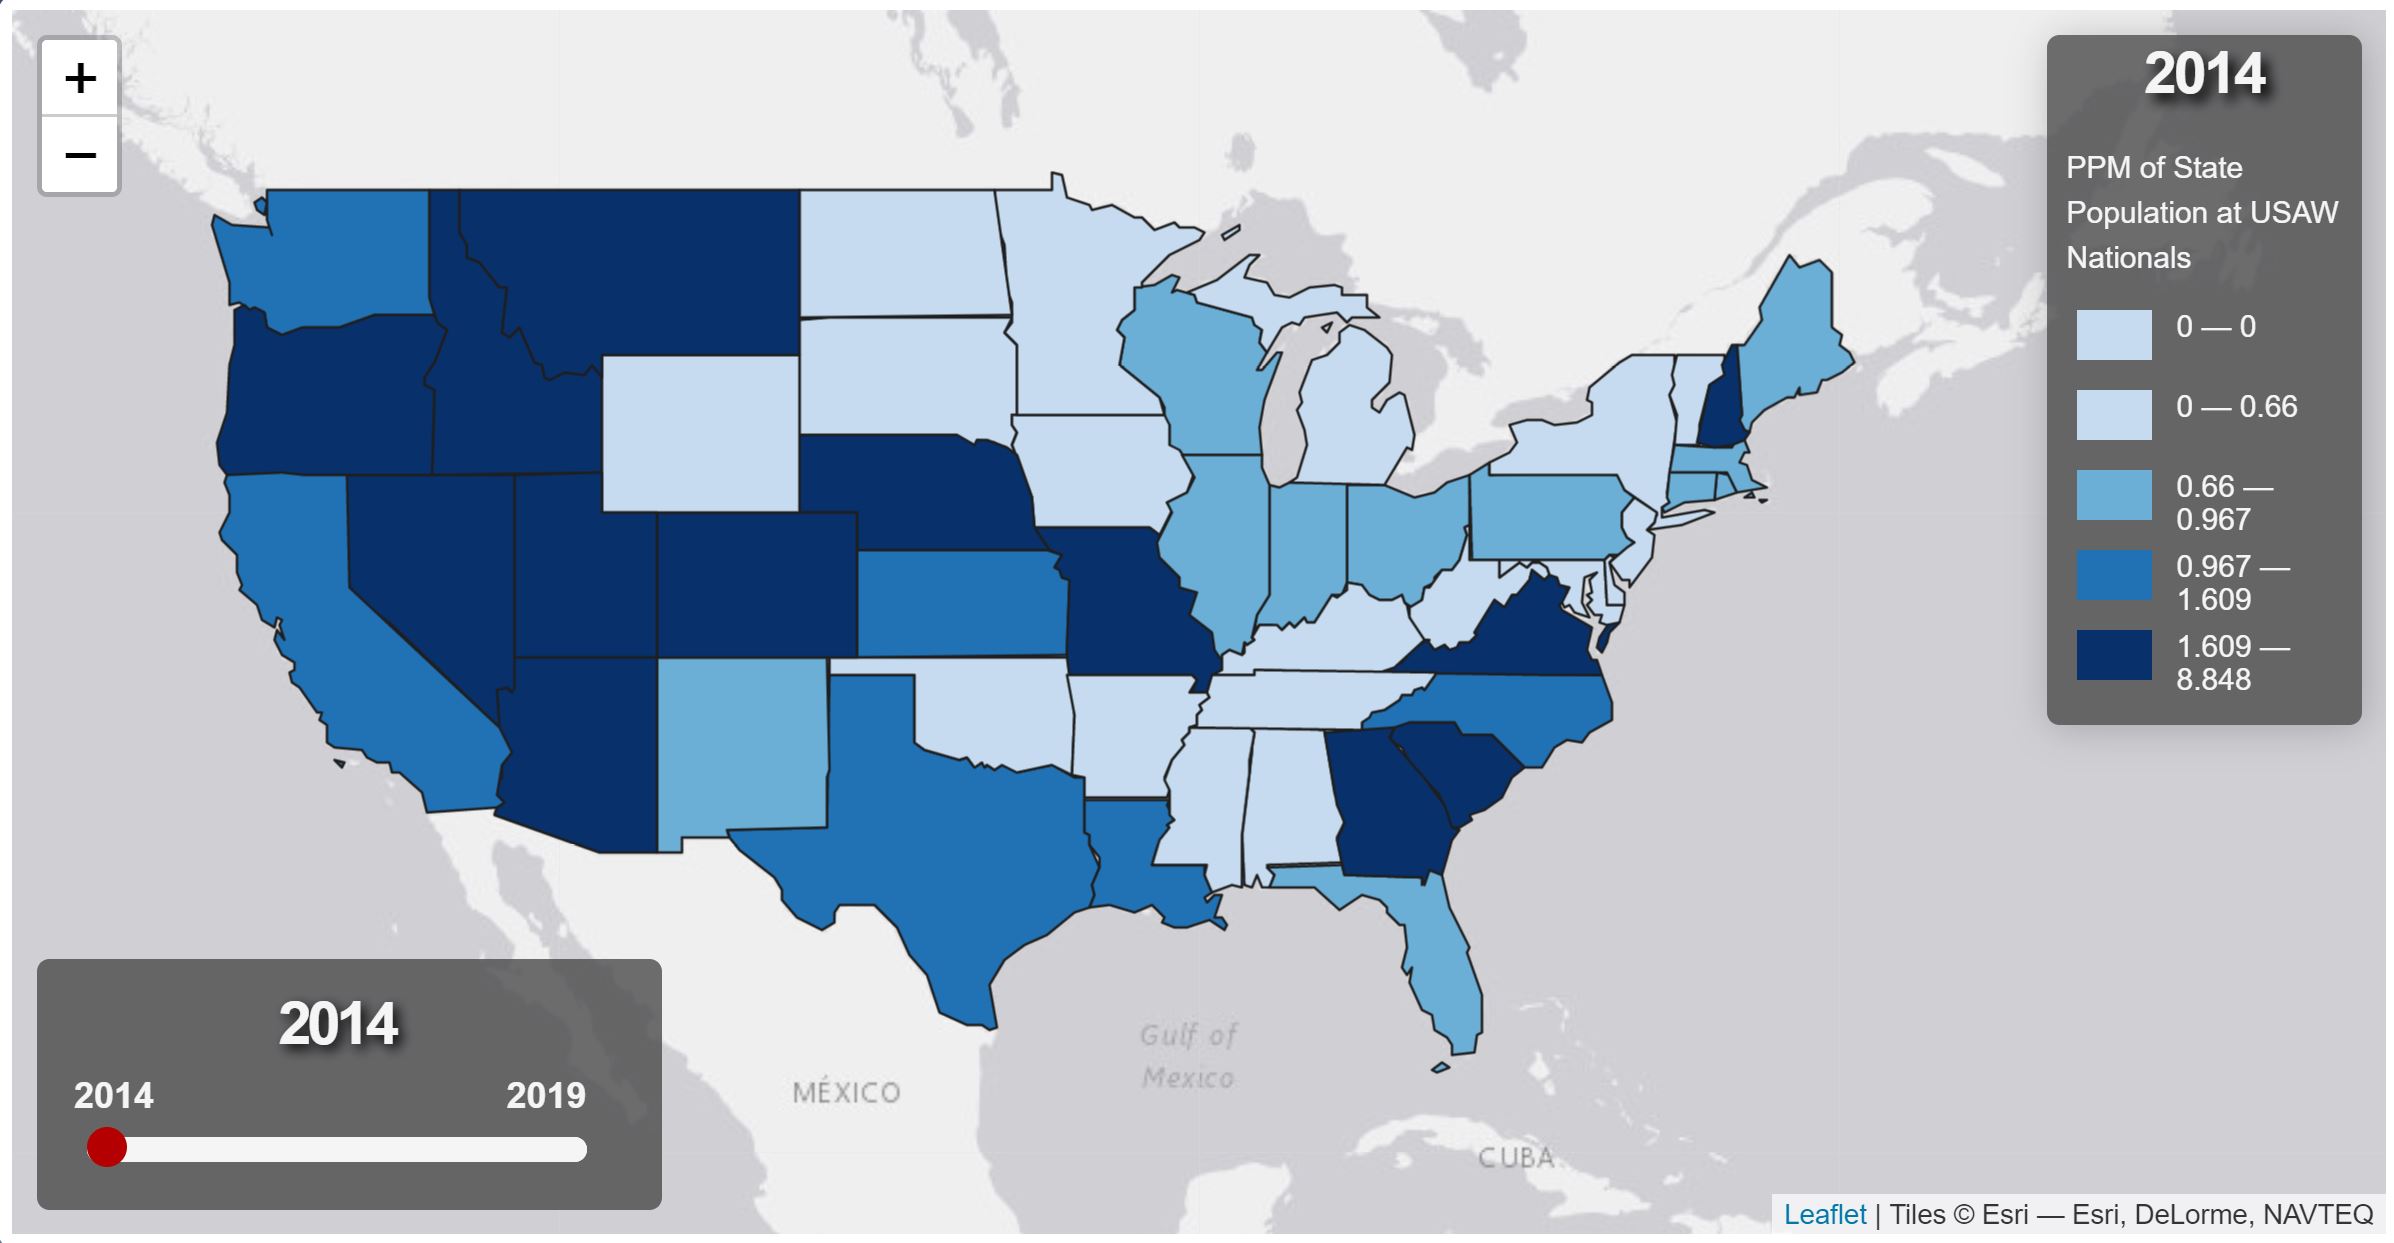
An interactive map webpage showing the number of lifters participating at US Weightlifting Nationals as ratio of each state's population from 2014-2019. Data accessed from the USA Weightlifting, compiled by the map author.